
Open the app's Developer Tools
Open an app's Developer Tools to inspect the page, debug your injected code or check how much memory and CPU it uses.
Pro feature
Developer Tools are available on the Pro plan and during the free trial. On Basic the button is visible but disabled. How to become Pro
Each app in Rambox is a web page, and like any page in Chrome, it has Developer Tools: the panel developers use to inspect a page's elements, read its console messages, see its network traffic and measure its performance.
You might need them to:
- test or debug the code you added with Inject JavaScript Code or Inject CSS Code;
- find the CSS selector of something you want to hide or restyle;
- check why an app isn't loading properly, or send our support team the errors it shows;
- see how much memory or CPU an app is using.
Open Developer Tools from the sidebar
- Right-click the app in the sidebar.
- In the menu that opens, click Developer Tools.
A separate Developer Tools window opens for that app.
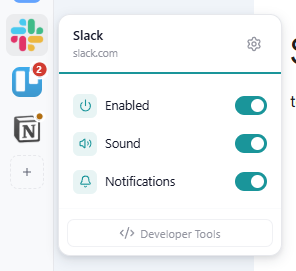
The button is disabled when the app is disabled. Enable the app first.
If the app is in a Tiles workspace, you'll find the same Developer Tools option in the tile's menu.
Inspect a specific element
To jump straight to a part of the page:
- Right-click that part of the page, inside the app.
- Choose Inspect Element.
Developer Tools opens with that element selected in the Elements panel.
Pop-up windows
If an app opened a pop-up window (for example, a video call or a sign-in window), right-click inside the pop-up and choose Inspect Element to open Developer Tools for that window.
On the Basic plan
On Basic, the Developer Tools button shows a PRO ribbon and can't be clicked, and the right-click menu shows Inspect Element (Pro plan).
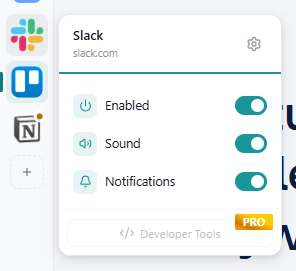
Want to see memory and CPU for every app at once?
The Apps manager shows the memory and CPU use of all your apps in one table, without opening Developer Tools. See Apps manager and alerts.
Using Rambox 2?
In Rambox 2, Developer Tools was an item of the menu you got by right-clicking the app icon. In Rambox 3 it's a button in the same right-click menu, next to the Enabled, Sound and Notifications switches.