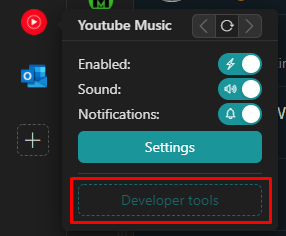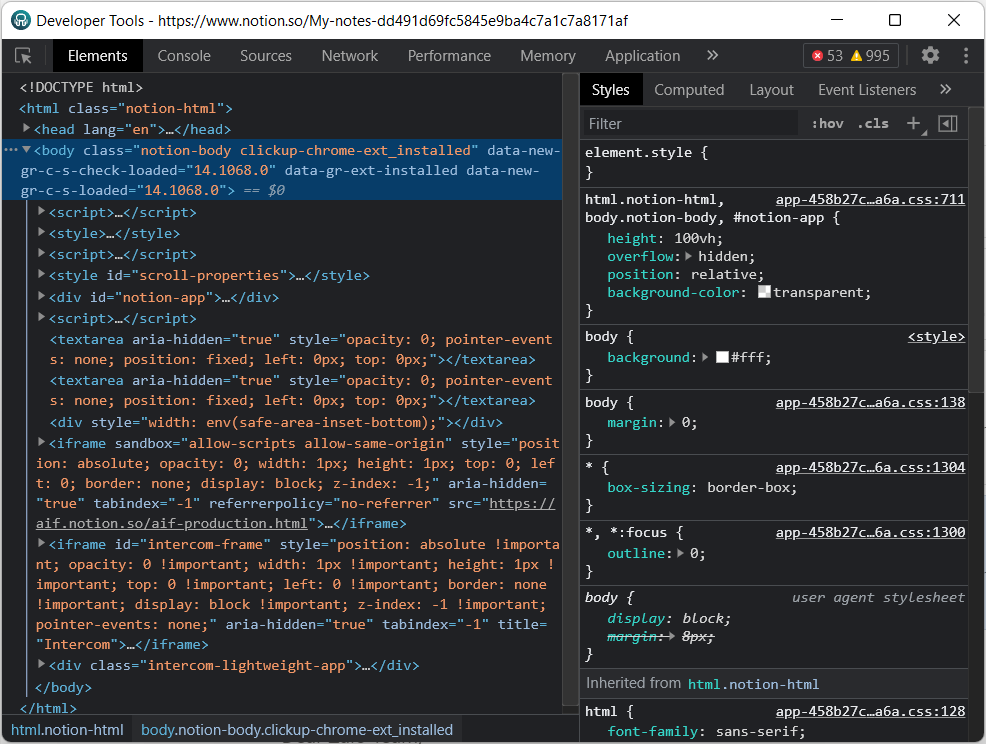
Open the app's Developer Tools
Open an app's Developer Tools to debug your injected code or check its performance.
Rambox offers a "Developer Tools" feature for users to check JS Inject Code, measure the performance of their apps or see how much memory an app is using, among others.
This is an exclusive feature included in our Pro plans, along with Extensions, Spell Checker, Proxy per app, and many more.
If you need to open the "Developer Tools" console for a specific app, you can right-click on the app icon and then click on "Developer Tools". A new Rambox's window will open showing these tools.